Companion to the printed poster · v74
What the data establish
Galaxy winding
Neither method establishes a preferred sky direction under the reported conditional tests. Agreement between winding labels is not accuracy.
Groups and clusters
Group/cluster H depends on selection and centre choice; conditional sign-null tests show no excess.
These are measurements of image winding and projected velocity patterns. They do not establish physical rotation or cosmic parity violation. The detailed assumptions and remaining limits are part of the result.
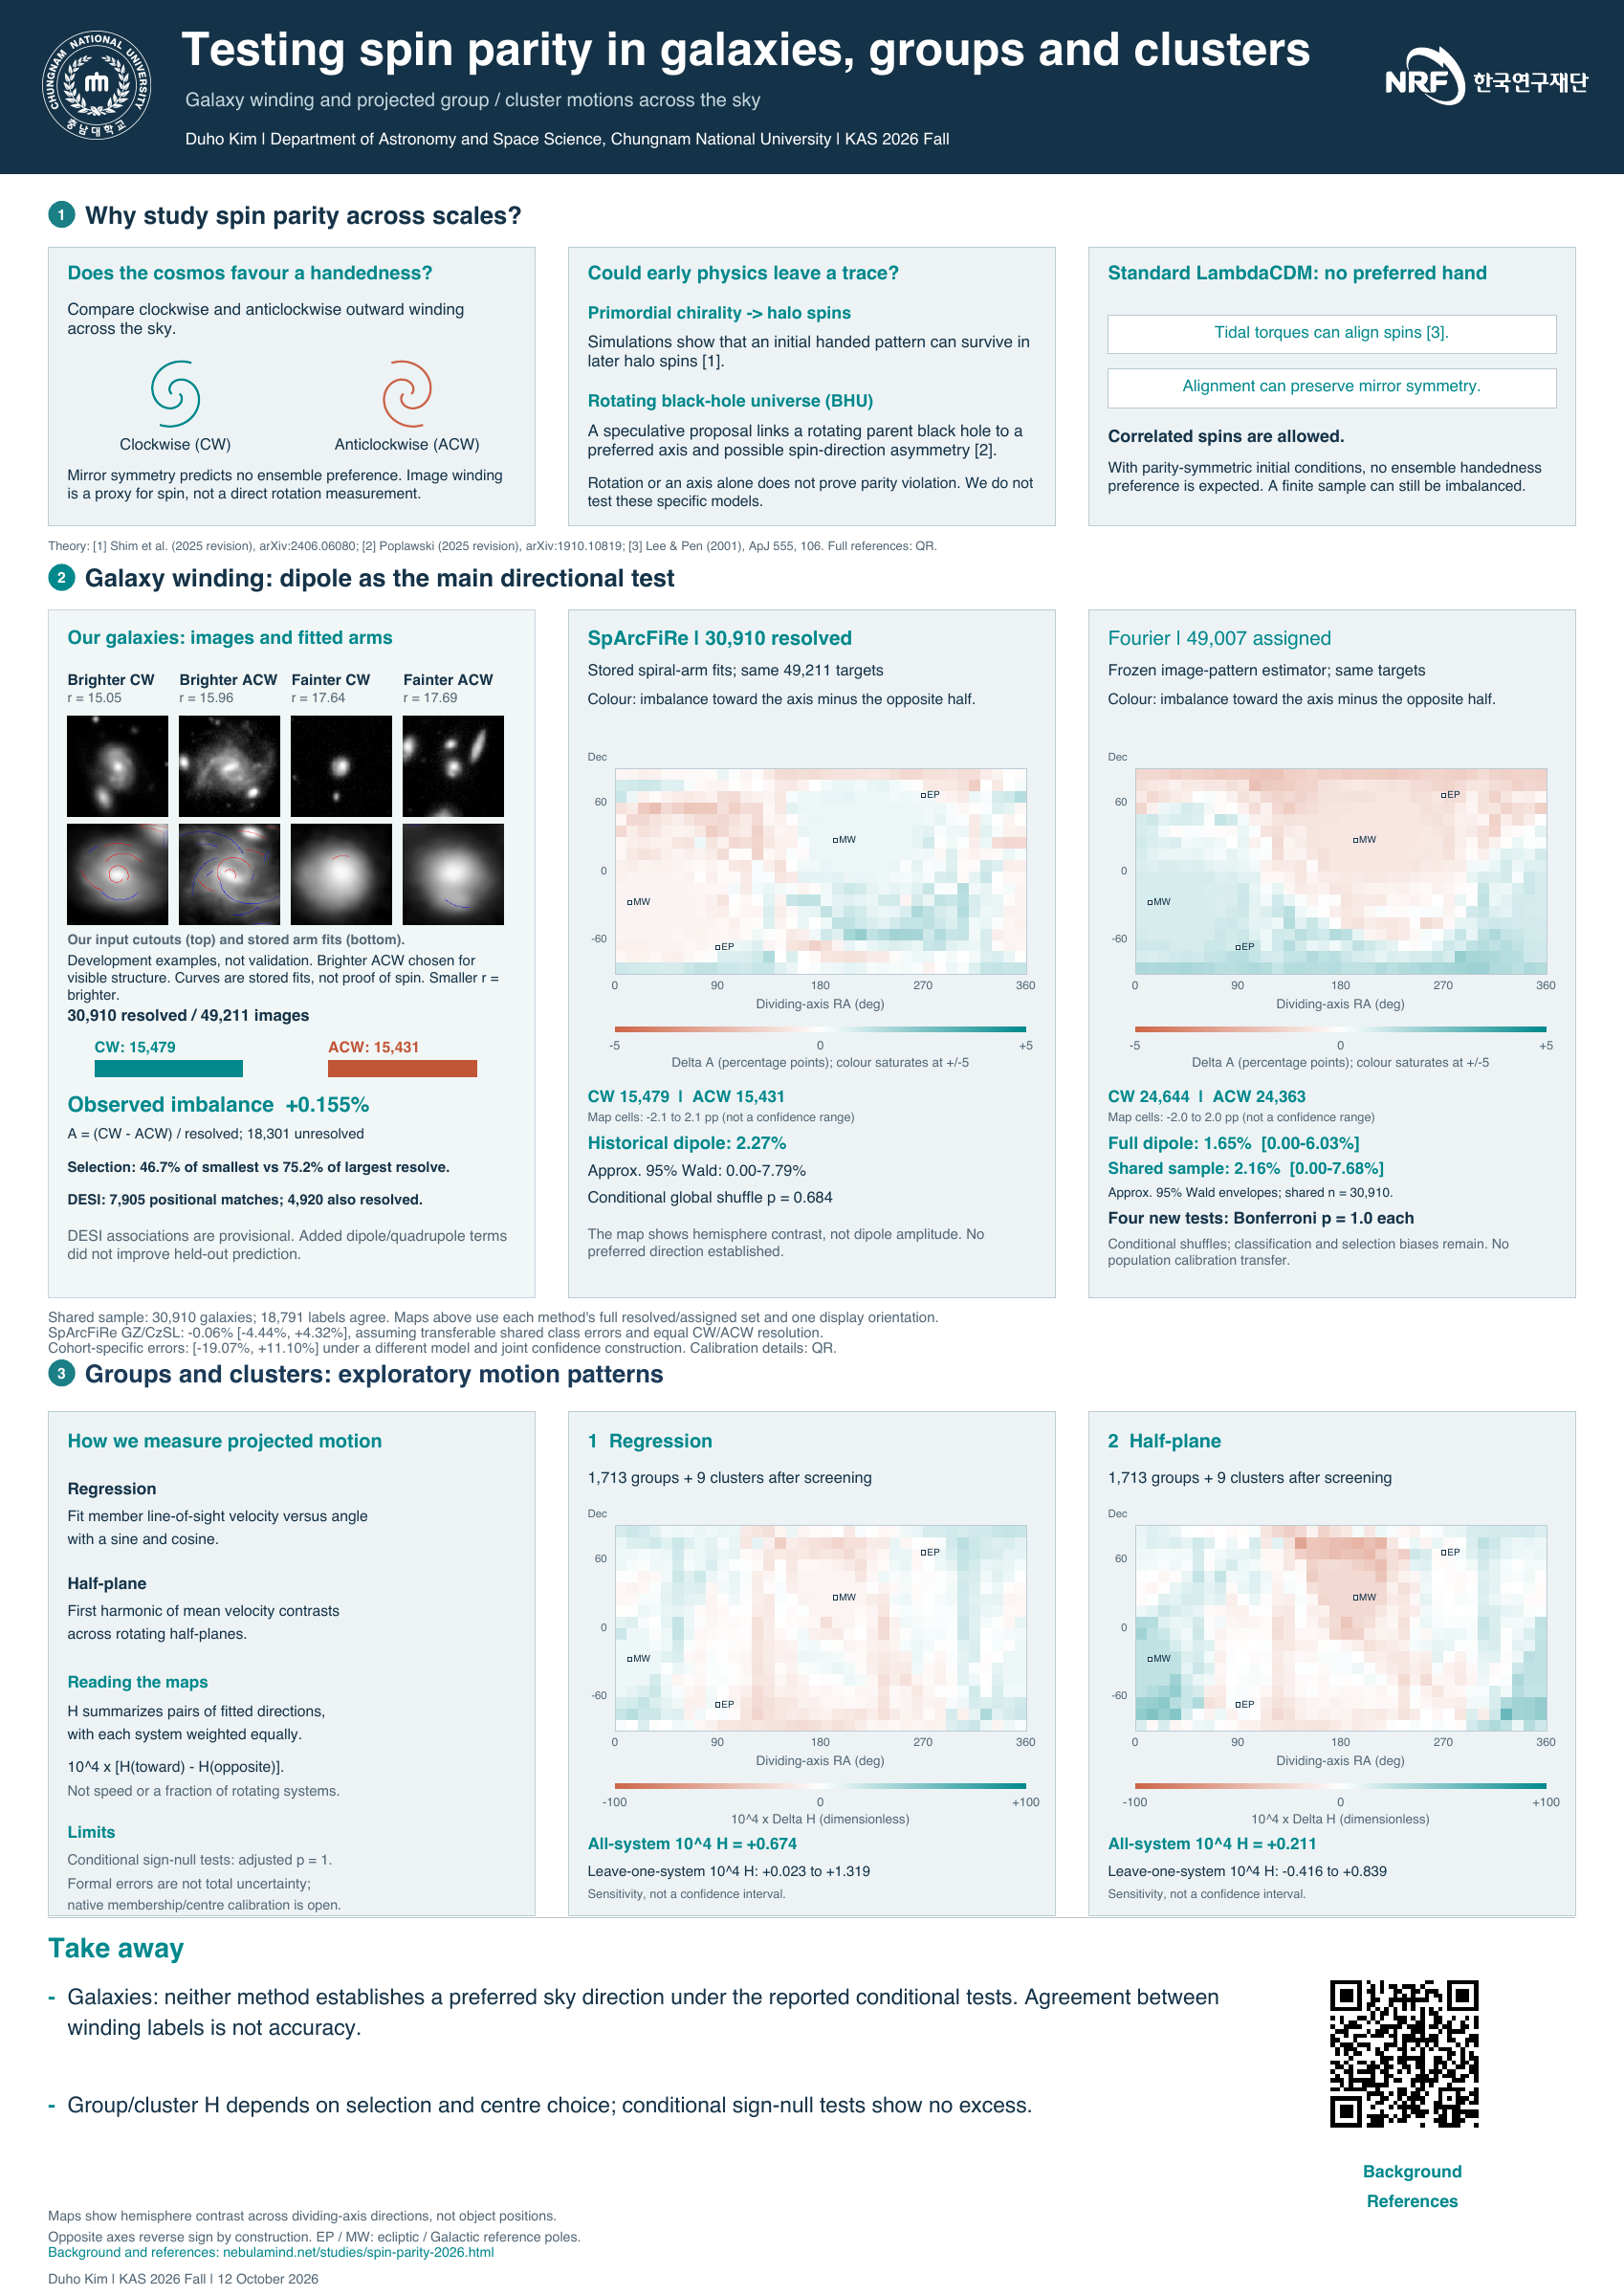 Download A0 poster · v74
The question
Spin alignment and parity are different
Parity compares a physical configuration with its spatial mirror. A population can contain aligned spins without preferring one handedness. The usual parity-symmetric ΛCDM baseline allows spin correlations and finite-sample fluctuations; it does not demand exactly equal clockwise and anticlockwise counts in every sample. [1]
Galaxy images reveal the apparent outward winding of spiral arms, not the full three-dimensional angular-momentum vector. Group and cluster spectra reveal line-of-sight member motions, which can also contain streaming, superposition and substructure. Connecting either observable to physical spin requires further assumptions.
Theoretical motivation and what this study does not test
Simulations with parity-breaking initial conditions show how primordial vector chirality can survive into halo-spin correlations. That motivates looking for suitable observables, but the winding and projected-motion statistics here are not a quantitative test of that model. [2]
Rotating parent-black-hole cosmologies offer a more speculative motivation for a preferred axis. A rotation axis alone does not establish parity violation: angular momentum is an axial vector. Isotropy and parity are distinct symmetries. [3]
A reproducible parity-odd cosmological signal, after observational systematics are excluded, would challenge the standard parity-symmetric assumptions. An observed map contrast or a fitted dipole alone is insufficient. Directional claims require explicit treatment of statistical inference and classification or selection bias. [4] [5]
S2 · Image winding
Two methods, one target inventory
Both methods start from the same 49,211 attempted targets. SpArcFiRe traces spiral-arm segments and can leave an image unresolved. The Fourier estimator compares opposite winding powers in log-polar image coordinates and uses a mirror-antisymmetrized score; its sign convention was fixed by algebra and synthetic orientation checks.
Each poster map uses its method’s own resolved or assigned set. The separate matched comparison retains all 30,910 common targets, including disagreements. Assignment coverage is not classification quality, and method agreement is not accuracy against physical spin truth.
Scroll the table horizontally for all columns →
| Method | CW | ACW | Unresolved / unavailable | Observed imbalance |
|---|---|---|---|---|
| SpArcFiRe | 15,479 | 15,431 | 18,301 unresolved | +0.155% |
| Fourier | 24,644 | 24,363 | 204 without a retained image tensor | +0.573% |
Observed imbalance is (CW − ACW) / assigned count. It is distinct from a dipole amplitude, a map contrast and a calibration-adjusted population estimate.
No preferred direction established
Scroll the table horizontally for all columns →
| Fit | Dipole amplitude | Approximate 95% Wald envelope | Conditional test |
|---|---|---|---|
| SpArcFiRe · 30,910 resolved | 2.27% | 0.00–7.79% | Global shuffle p = 0.684 |
| Fourier · 49,007 assigned | 1.65% | 0.00–6.03% | Fourier full/shared dipoles and maximum hemisphere contrasts: all four Bonferroni-adjusted p = 1 |
| Fourier · 30,910 shared | 2.16% | 0.00–7.68% |
The fitted direction is not an established cosmic axis when the directional result is consistent with zero. These uncertainty envelopes and shuffle tests do not remove classification, selection or dependence biases. Full Fourier follow-up and assumptions.
Calibration: human reference labels and transfer assumptions
The retained SpArcFiRe calibration uses 213 jointly resolved high-consensus Galaxy Zoo comparisons and 5,397 jointly resolved comparisons with a human-labelled reference sample associated with CzSL. “Expert” means human reference labels, not an AI reviewer. These samples do not directly measure physical spin. [6] [7]
| Scenario | Conditional 95% range | Assumption |
|---|---|---|
| Galaxy Zoo only | −17.93% to +10.03% | GZ directional errors transfer |
| CzSL reference only | −4.37% to +4.56% | CzSL directional errors transfer |
| Shared directional errors | −4.44% to +4.32% | Common transferable errors; point estimate −0.06% |
| Cohort-specific error brackets | −19.07% to +11.10% | Science errors fall within the specified GZ/CzSL brackets; no unique point estimate |
All four scenarios assume equal CW/ACW resolution. The first three use simultaneous M3 binomial-margin control; the bracketed scenario uses M5 and a different model. Their widths are not interchangeable measures of the same uncertainty. Full-population transfer remains unvalidated.
Assuming a resolution bias of −1%, 0% or +1% changes the pooled estimate to +0.94%, −0.06% or −1.06%. These are assumed-bias sensitivity cases, not measured selection corrections. Resolution varies with image properties; unresolved targets remain in the accounting.
S3 · Projected member motions
Exploratory patterns in 1,722 systems
The current poster uses the same 1,713 groups and 9 clusters for both estimators after a fixed proximity screen. Each system contributes one equally weighted projected direction. Similar directions from the two methods are correlated estimates from the same members, not independent confirmations of physical rotation.
Regression
Fit member line-of-sight velocity versus position angle with an intercept, sine and cosine. Their coefficients give a projected direction of increasing velocity.
Half-plane
Rotate a dividing line, compare the two mean member velocities, and extract the first harmonic of that contrast.
| Method | Pooled 10⁴H | Leave-one-system range |
|---|---|---|
| Regression | +0.674 | +0.023 to +1.319 |
| Half-plane | +0.211 | −0.416 to +0.839 |
Leave-one-system ranges measure sensitivity, not confidence intervals. Omitting one system can reverse the half-plane sign. H is dimensionless and is not a velocity or a fraction of rotating systems.
Sample accounting and why selection matters
Of 1,934 eligible groups, one was refused at source validation and four lack a primary-aperture fit. There are 1,929 fitted groups and ten retained clusters before screening. The fixed 3 Mpc / 3,000 km/s proximity screen removes 216 groups and one cluster from overlapping components, leaving the displayed 1,722 systems. This screen does not prove independent membership.
Scroll the table horizontally for all columns →
| Sample | N | Regression | Half-plane |
|---|---|---|---|
| All fitted groups | 1,929 | −2.741947 | −3.205278 |
| Screened groups | 1,713 | +0.273061 | −0.322342 |
| All fitted groups + clusters | 1,939 | −2.066542 | −2.439433 |
| Screened groups + clusters | 1,722 | +0.673972 | +0.210983 |
Screening changes the regression sign in the group-only comparison. Half-plane H remains negative until the nine retained clusters are included. Each sample has its own pair denominator; this arithmetic comparison is not causal attribution or a new significance test.
In the displayed sample, 1,705 of 1,722 method pairs differ by less than 45°, with a median directed angle of 10.43°. This is method agreement, not accuracy against true spin directions. Saved sample and method audit.
Map guide
Every map cell is a dividing axis
- Choose a candidate direction on the sky. It divides the catalogue into a toward hemisphere and an opposite hemisphere.
- Compute the statistic in each half and subtract: toward minus opposite.
- Place that contrast at the candidate direction. The coloured cell is not an object position or a detection significance.
- Reversing the axis swaps the halves and reverses the sign by construction. EP / MW mark fixed ecliptic / Galactic reference poles.
Galaxy maps
A = (CW − ACW) / N. Colour is A(toward) − A(opposite), in percentage points. A contrast of 0.02 is 2 percentage points.
Group / cluster maps
Colour is 10⁴ × [H(toward) − H(opposite)]. A displayed 100 means ΔH = 0.01, not 100% of systems.
Definition of H, display scales and masks
Let ni be the unit sky-position vector of system i; gi its unit projected velocity-gradient vector; and qi = ni × gi. Then
This equals the signed pairwise statistic used here. A zero fitted vector remains zero and still counts in N. Reversing all velocity directions together leaves pooled H unchanged; spatial inversion changes its sign. Zero H means no net handedness in this statistic, not proof that physical parity is conserved.
The maps use 648 candidate axes on a 10° grid. Galaxy colours share a linear scale saturating at ±5 percentage points; observed map ranges are ±2.1 points for SpArcFiRe and ±2.0 for Fourier. Those ranges are not uncertainty intervals. A half with fewer than 30 galaxies, or a boundary tie, is masked.
The two current group/cluster maps use the same systems, partitions and masks, requiring at least three systems in each half. Their shared linear scale saturates at ±100 in units of 10⁴ ΔH. There is no third, independent “mean” measurement. Older descriptive mean-map products remain in the archive only.
Saved aggregate maps, counts and masks (historical filename; retained measurements, including archived mean values).
Different tests answer different questions
Conditional tests and sensitivity
Conditional sign tests ask whether the saved pattern is unusual after reversing specified fitted directions while holding the sample and other geometry fixed. Error propagation asks how a specified measurement-error model perturbs the estimates. Selection and centre shifts probe particular analysis choices. None provides a complete joint uncertainty model.
| Check | What was held fixed / varied | Result and scope |
|---|---|---|
| Whole-system sign null | 1,722 systems; 2,048 sign patterns. Each system’s sign is shared by both methods. | Four adjusted p = 1: pooled |H| and maximum |ΔH| for each method. |
| Spatial-block sign nulls | Four 50 / 100 Mpc cube partitions, with zero / half-cell origins; 2,048 patterns each. | All 16 adjusted p = 1 in a separate family. Arbitrary cube boundaries are not a calibrated cosmological null. |
| Formal redshift errors | 1,024 conditional perturbations; members, centres and reference redshifts fixed. | Includes exact matched formal errors for all 1,322 retained cluster spectra. Perturbation quantiles are not total uncertainty. |
| Centre-angle stress | Four fixed 100 kpc shifts. Same 1,681 groups + nine fixed clusters in every comparison. | Some shifts reverse pooled H for both methods. This is a 1,690-system subset, not the primary sample. |
| Saved member cuts | Same 1,040 groups + nine fixed clusters under three saved variants. | All matched-subset pooled H values are negative. Its 1,049 systems differ from the primary sample. |
An adjusted p of 1 is a multiple-test correction capped at 1. It is not a probability that the Universe is random, and does not prove absence of rotation or parity violation.
Sign-null definitions and unadjusted values
The whole-system null fixes positions, observed unoriented axes, magnitudes and selection. The four statistics use both methods’ absolute pooled H and maximum absolute contrast across the same 648 axes. In the order regression |H|, half-plane |H|, regression max|ΔH|, half-plane max|ΔH|, the raw p-values are 0.854075, 0.953636, 0.958516 and 0.594436, respectively; Bonferroni correction across this four-test family gives 1 for each.
The block variants share one sign within each cube and across methods. Their raw values span 0.570034–0.973646, with Bonferroni correction across a separate 16-test family. Within-block pair terms stay fixed, so the signed-H null mean need not be zero. These retrospective tests share data and are not independent replications. Monte Carlo p = (exceedances + 1) / 2,049.
The maps were already seen before these follow-ups. Neither family calibrates the response to a physical parity model or establishes a cosmological correlation length. All 16 block-test values and scope notes.
Formal-error quantiles, fixed centre shifts and saved selection variants
| Method | Observed | 16th / 50th / 84th percentiles |
|---|---|---|
| Regression | +0.673972 | +0.225361 / +0.770468 / +1.256272 |
| Half-plane | +0.210983 | −0.244285 / +0.279904 / +0.821382 |
The Gaussian formal-error assumption is uncalibrated here; fixed reference redshifts and independent spectral errors omit membership, centring, reference-redshift and correlated-error uncertainty. The positive regression bracket is not a detection. Stored group normal draws were reused, with a new cluster-only stream; reconstruction differences mean the change from the older calculation does not isolate cluster noise exactly.
| Angle origin | Regression | Half-plane |
|---|---|---|
| Matched baseline | +0.53 | +0.09 |
| East 100 kpc | +2.83 | +4.31 |
| West 100 kpc | −2.50 | −3.65 |
| North 100 kpc | −4.89 | −4.03 |
| South 100 kpc | +0.39 | +1.53 |
Only the member-angle origin changes; members, velocities, sky centres, tangent bases and nine cluster vectors remain fixed. Thirty-two distinct groups fail the angle-coverage requirement in at least one shift. The matched sample may favour extended or richer groups; a fixed 100 kpc shift is not a draw from a centre-probability model.
| Variant | Regression | Half-plane |
|---|---|---|
| P15 · 1.5 Mpc baseline | −4.367723 | −3.951468 |
| S075 · 0.75 Mpc aperture | −3.955682 | −3.654016 |
| V15C · 1.5 Mpc, 1,500 km/s cut | −4.316008 | −3.911802 |
The smaller aperture excludes 673 original groups from the matched comparison: 664 fail its member-count requirement and nine its azimuthal coverage requirement. V15C has identical membership to P15 for 1,039 of the 1,040 matched groups, so its apparent stability adds little independent evidence. Compare cuts within this subset; comparing its negative H with the positive primary result also changes sample composition.
Coverage and interpretation
External probabilities are not yet native probabilities
Bounded redMaPPer retrieval obtained 7,025 member rows for 133 candidate external hosts. Local association found 326 unique positional candidate counterparts: 158 across 30 groups and 168 across two clusters. The original accounting retains 23,623 member occurrences; these are different counting units and should not be turned into a simple completeness percentage.
Of the 326 candidates, 118 lack external spectroscopic redshift. A positional match alone does not confirm the external host or native membership. Missing coverage remains unknown, not non-membership.
- Membership information retained
- redMaPPer
PMemdescribes membership in its external host model.Pfree, luminosity and radial terms remain separate. No new weighting, membership fit or H map was made from them. - Centre information retained
- The external host catalogue contains five candidate-centre positions and
PCen0…PCen4. They are not calibrated centre probabilities for our differently defined systems, nor a justified Gaussian covariance. - Native catalogue limit
- The documented DESI Gfinder products used here list categorical central / satellite
RANK, without a calibrated membership posterior or centre covariance. This describes those documented products, not all possible models. [10]
What calibration would require
- Freeze catalogue versions, target definitions and all competing host associations; retain unmatched cases.
- Validate host identity with independent position, redshift and richness criteria and a suitable spectroscopic or mock truth sample.
- Test external membership calibration for the actual selection, colours and radial coverage; validate candidate centres against independent centring evidence.
- Specify and independently assess a joint membership / centre model before reweighting or refitting H.
The retained host table has 26,111 rows versus 26,311 in the associated abstract; this discrepancy remains unresolved and prevents a catalogue-wide completeness claim. The stored centre-probability acceptance flag remains false. Retrieved data are available for investigation; transfer validity has not been established.
Existing member-association scope note. The centre information and continuing transfer limits are summarized here and in the v74 research notes.
Supporting methods
What the controlled estimator test tells us
A small synthetic experiment checks how the retained group estimators respond to prescribed velocity fields. It is a validation aid, not an observational discovery or a realistic simulation of the catalogue. It is therefore kept here with the methods, outside the poster’s headline conclusions.
Noise, an injected sine pattern and an imposed two-part split
Eight fixed ring geometries cover 12, 24, 48 or 96 members with uniform or skewed angular sampling. Noise-only, sine and split fields use independent Gaussian unit scatter. The grid contains 200 case rows; evaluation noise is shared across cases and methods for paired comparisons.
Each geometry and method has its own threshold: the 974th ordered amplitude among 1,024 noise-calibration draws. An evaluation amplitude strictly above that threshold is a toy amplitude flag, not a classification of physical rotation.
Scroll the table horizontally for all columns →
| Method | Noise only | Sine field | Split field |
|---|---|---|---|
| Regression | 11 / 256 | 230 / 256 | 208 / 256 |
| Half-plane | 8 / 256 | 229 / 256 | 208 / 256 |
The sine mean is A cos(φ − ψ); the split mean is A/√2 × sign[cos(φ − ψ)]. Both can trigger the estimators. A fitted projected direction therefore cannot, by itself, distinguish the prescribed sine field (one projected rotation-like pattern) from this split pattern.
The example was selected before the draws. It is three rows from the full grid, not selected for its outcome. All 200 aggregate rows and pointwise intervals are available. The Wilson intervals condition on the estimated threshold and toy model; calibration-quantile uncertainty is omitted.
These rings do not reproduce realistic radial distributions, contaminants, membership selection or cluster dynamics. Cluster-specific estimators were not tested. The experiment does not calibrate real-system rotation probabilities or the detection sensitivity of population H / parity statistics.
Scientific limits
What remains open
- From a proxy to physical spin
- Image winding is not a full angular-momentum measurement. Projected velocity gradients can arise without coherent rotation. Realistic dynamical and contamination tests are still needed.
- Selection and calibration transfer
- Human reference samples, unresolved galaxies, survey footprint and residual dependence can affect the winding inference. Reference calibration has not been established for the full science population.
- A joint uncertainty model
- Formal spectral errors, fixed centre stresses and member-cut comparisons address separate components. Native membership / centre calibration and their dependence remain open.
- Power against physical alternatives
- The conditional null tests do not establish which cosmological parity signals the full pipeline could detect. The controlled group-estimator test does not close that gap.
The present contribution is an explicitly scoped measurement and comparison of observable patterns. No robust physical spin-parity detection has been established. More precise interpretation requires new evidence or calibrated models, not stronger wording.
Primary sources
Background, methods and catalogues
- Lee & Pen (2001), Galaxy Spin Statistics and Spin-Density CorrelationSpin correlations and the gravitational-alignment context.
- Shim et al. (2025 revision), Probing vector chirality in the early UniverseParity-breaking initial conditions and halo-spin correlations; motivation rather than a model fitted here.
- Popławski (2025 revision), Universe in a rotating black hole and preferred axisSpeculative preferred-axis motivation; not a demonstrated interpretation of this study.
- Patel & Desmond (2024), No evidence for anisotropy in galaxy spin directionsCatalogue reanalysis and directional-inference methodology.
- Hayes et al. (2017), galaxy chirality and selection-bias testsWhy sample construction and classification bias matter.
- Land et al. (2008), Galaxy Zoo and galaxy-spin statisticsHuman winding classifications and bias control.
- Jiménez et al. (2023), CzSL: Learning from citizen science, experts and unlabelled data in astronomical image classificationContext for the human-labelled reference samples.
- Hwang & Lee (2007); Manolopoulou & Plionis (2017); Song et al. (2018)Cluster projected-motion analyses. Different selections, apertures and direction conventions are not pooled as interchangeable measurements.
- Castellani et al. (2025), cluster selection definitions, §2.1Centre and velocity-selection conventions do not supply native per-member probabilities.
- DESI DR1 Gfinder catalogue documentation; redMaPPer catalogue schema, CDS J/ApJS/224/1Native categorical assignments versus external membership and centre products.
- Legacy Surveys DR9; SDSS SkyServerIllustrative group-core and A2107 photographs. The core views do not show the full membership footprints.
Poster and research record
Read, download and check the evidence
Poster v74 is the selected print version. The PDF below is preserved byte for byte. This page expands its methods, evidence and limitations.
A0 portrait · embedded fonts · existing illustrative cutouts retain their native detail, approximately 58–125 ppi at A0. Digital checking does not replace a physical print proof; no PDF/X or printer-specific colour certification is claimed.
- Research notes and all block-test valuesDefinitions, sample denominators, conditional assumptions and the scope of the current results.
- Full controlled-test aggregate resultsAll 200 saved case rows, thresholds and pointwise intervals; no private catalogue rows or random-draw arrays.
- Evidence indexContent hashes and source descriptions for the retained inputs to this companion. No local filesystem paths.
- Download checksumsVerify the print PDF, preview and supporting files.
Earlier analyses and preserved versions
Older products are retained as historical evidence. Their version-specific statements about missing data or the current poster may have been superseded. The present page distinguishes the primary 1,722-system sample from the earlier 102-system pilot.
- Previous research page (v69) · v69 print PDF · v69 evidence package.
- Fourier follow-up tables and assumptions · PDF supplement.
- Saved-vector and sample-dependence audit · Formal-error and membership update · Historical 45-claim register.
- Earlier 102-system pilot poster. It combines 80 selected groups, ten clusters and 12 literature systems; it is not the current map sample or an independent replication.
The earlier mean map is a descriptive average of two correlated estimators, not a third measurement. Literature-only systems without a second matched estimator remain outside the current matched maps.
Contributions and scope of checking
Duho Kim supplied the research idea and supervised the study. Under that supervision, the Codex-led workflow performed implementation, data processing and analysis, literature synthesis, figures and drafting; other AI models contributed code and reviews. Observational data, human reference labels and software remain credited to their original sources.
Separate numerical implementations checked retained calculations, and model-assisted reviews checked methods and claims. These checks do not provide independent observational evidence or conventional journal peer review. The v74 poster had digital checks and local visual inspection; a physical print proof remains a separate step.