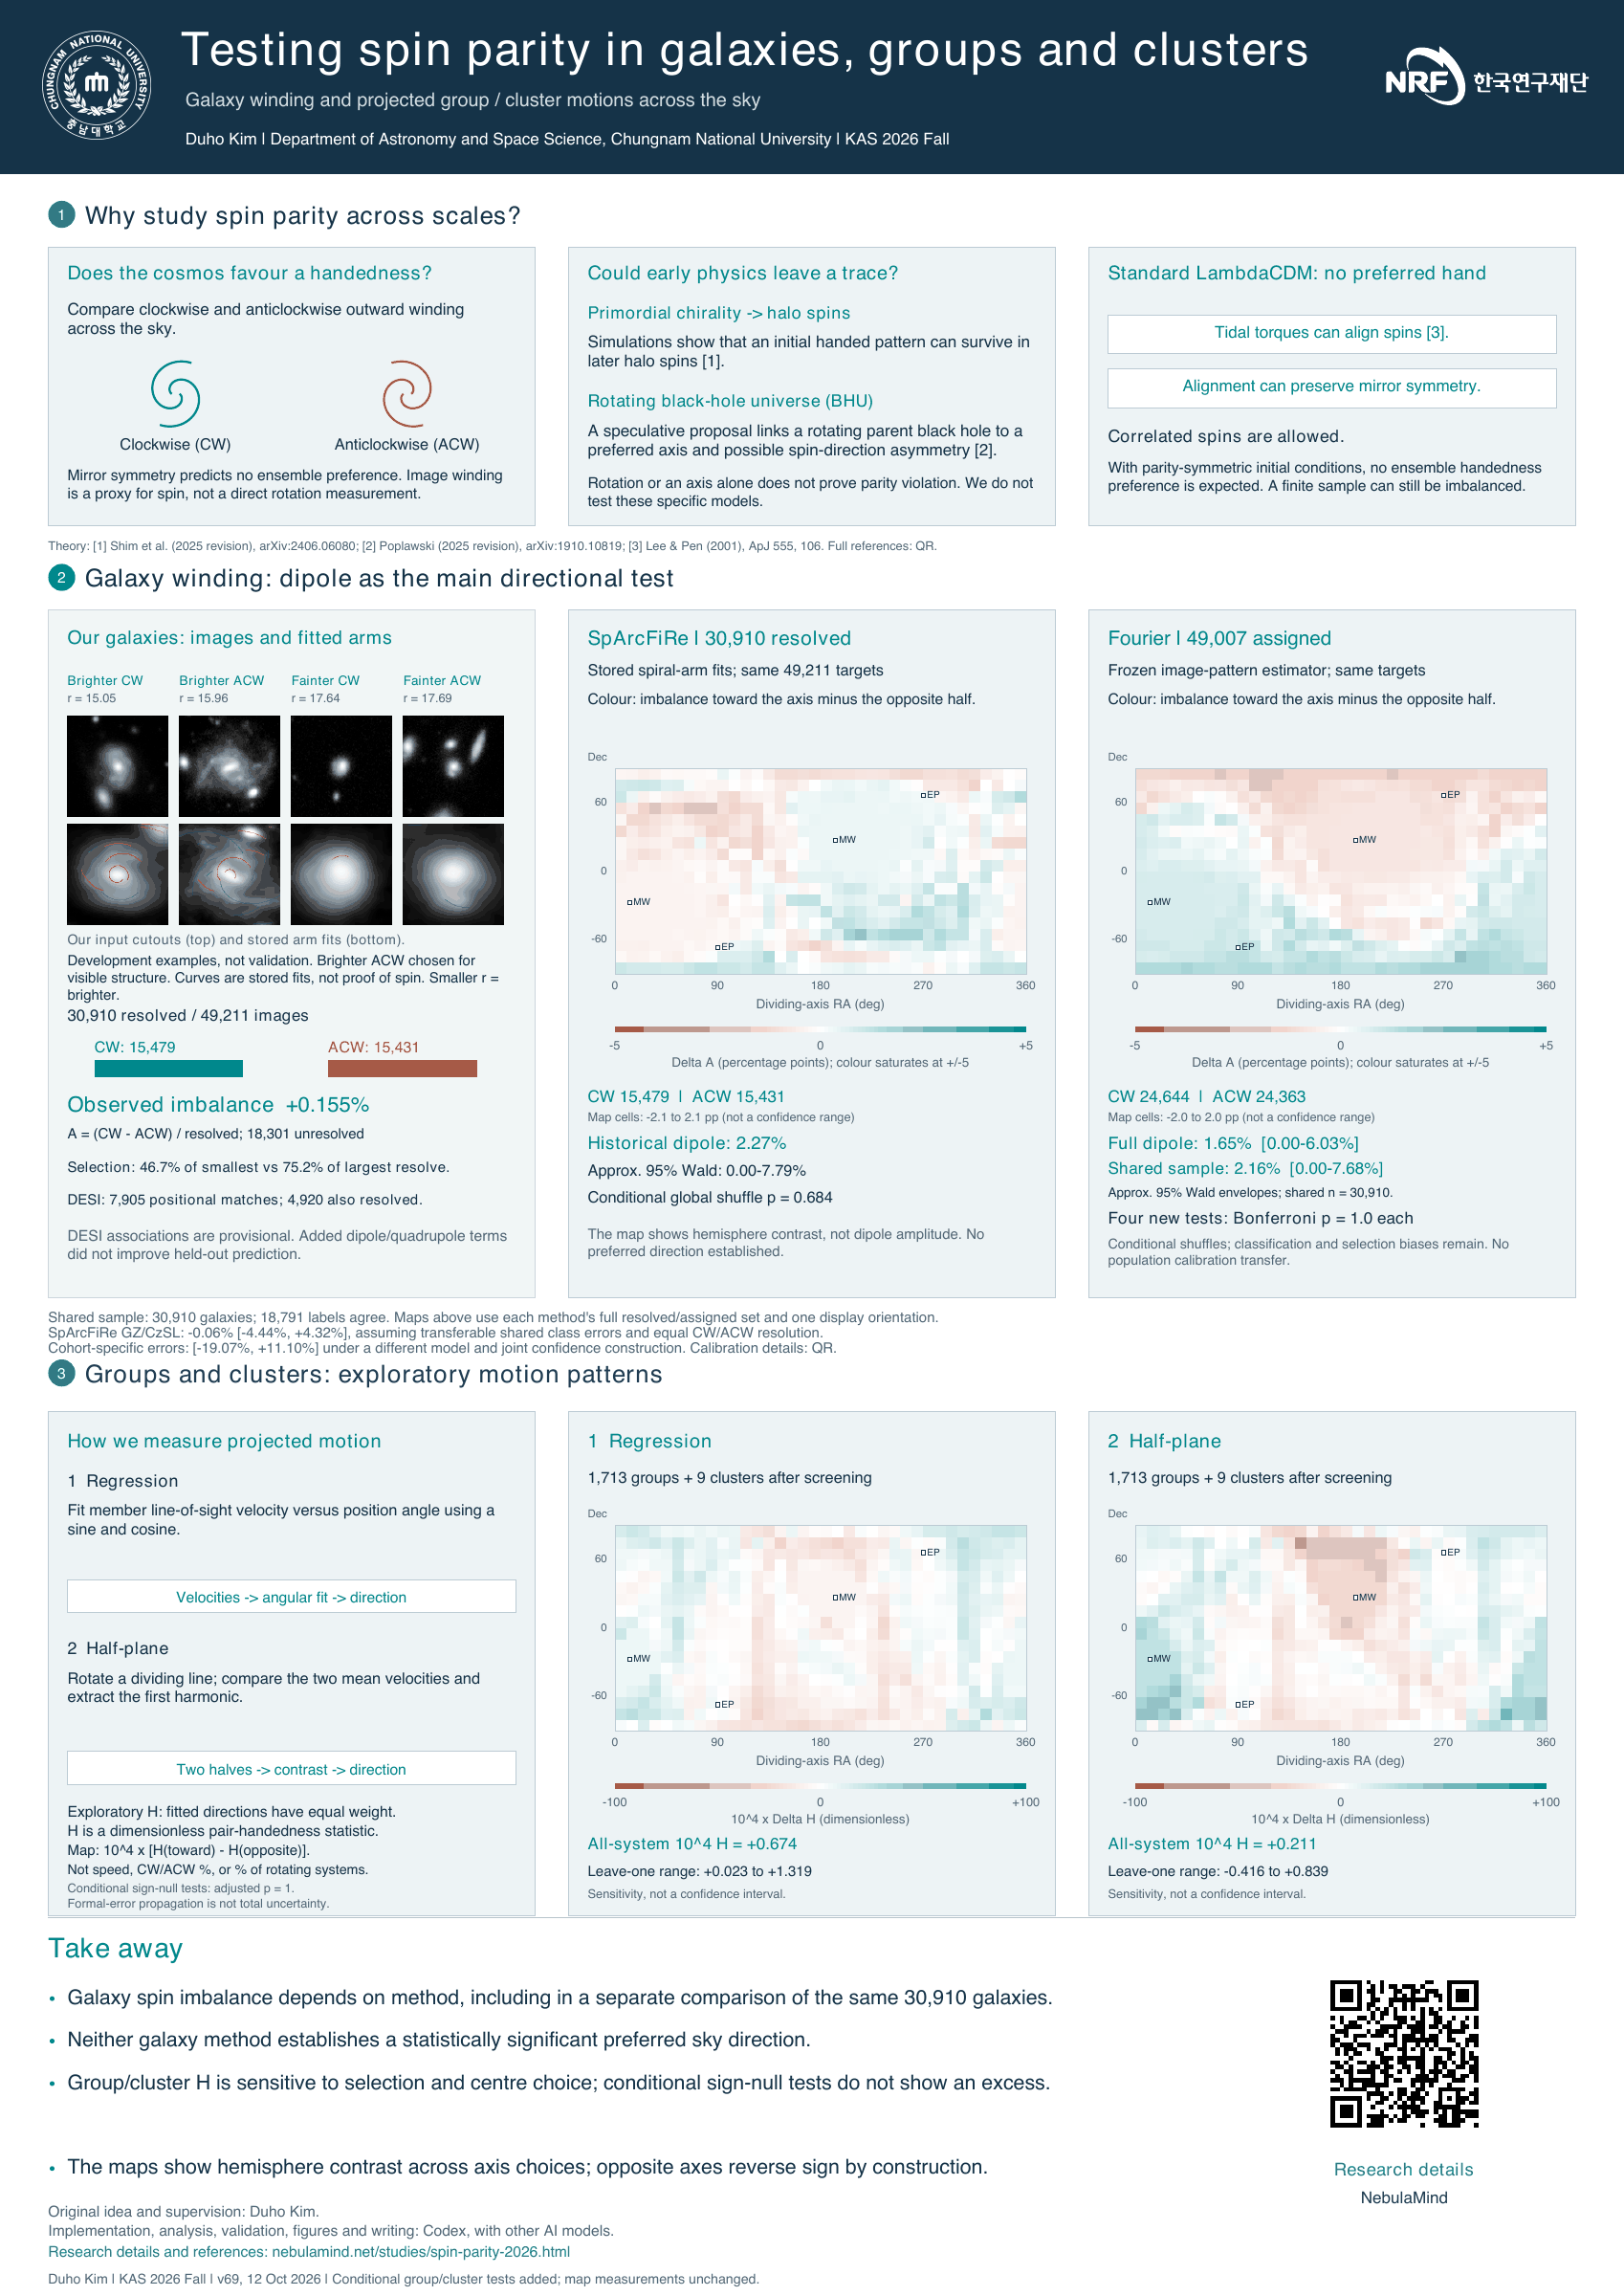
12 October update: conditional tests, uncertainty and membership coverage
Poster v69 incorporates the completed group/cluster validation. Its measured maps are unchanged. The primary sample remains 1,722 systems: 1,713 groups and 9 clusters.
Conditional tests did not find an excess
Whole-system sign randomization used 2,048 patterns and four statistics: absolute pooled H and maximum absolute hemisphere contrast for each of the two methods. All four Bonferroni-adjusted p-values are 1. Four spatial-block variants (50/100 Mpc cells, zero/half-cell origins, 2,048 patterns each) also give adjusted p = 1 across their separate 16-test family; their raw p-values span 0.570034–0.973646. The block null can have a nonzero mean. These are conditional sensitivity tests, not a calibrated cosmological null or a probability that the Universe is exactly random.
Formal errors and sensitivity answer different questions
All 1,322 retained cluster spectra now have identity-matched positive formal redshift errors. The 1,024-draw propagation holds members, centres and reference redshifts fixed; its perturbation quantiles are not total uncertainty or membership/centre confidence intervals. Four fixed 100 kpc centre shifts use a matched 1,690-system subset. Saved selection comparisons use the same 1,049 systems (1,040 groups and 9 clusters). Their pooled H values are negative for both methods in all three cut variants. Comparing that subset with the primary 1,722 also changes sample composition. V15C changes membership for only one of the 1,040 groups, limiting what its apparent stability establishes.
External membership information has limited coverage
Six bounded catalogue requests retrieved 7,025 redMaPPer member rows for 133 candidate external hosts. Local checks found 326 unique positional candidate counterparts: 158 across 30 groups and 168 across 2 clusters. Of these candidates, 118 lack external spectroscopic redshift. All 23,623 original member occurrences remain in the accounting. The matched catalogue PMem belongs to the external redMaPPer host model; it is not a native Gfinder membership posterior. Uncovered objects are unknown, not nonmembers. No probability weighting, refitting or map changes were performed.
No statistically established physical spin-parity detection is claimed. Formal errors, selection and centre sensitivity, and external membership coverage must remain distinct.
A0 print copy with embedded fontsDownload poster and evidence package
Scientific audit · 45-claim evidence register · Membership coverage and matching scope · Print instructions and limits · Preserved v68
The public register identifies retained evidence by content hashes; private catalogues and local filesystem paths are not included. Source and claims were reviewed through Claude Code; the final poster was visually checked locally by the same workflow that prepared it, not by an independent external image reviewer. Model review is not journal peer review. The print copy embeds Helvetica and retains the original text placement and image pixels; some illustrative cutouts remain 58–125 ppi at A0. Neither PDF/X certification nor a physical printer proof is claimed.
11 October audit: method agreement and sample dependence
The two galaxy panels use each method's full resolved/assigned sample. A separate matched comparison uses the same 30,910 galaxies, with 18,791 labels agreeing (60.8%). Poster v68 clarifies this distinction and the assumptions behind the historical SpArcFiRe calibration; its maps, signs, images and contribution statement are retained.
Group and cluster methods usually point in similar directions
For the displayed 1,722 systems, 1,705 (99.0%) regression/half-plane vector pairs differ by less than 45°, 17 differ by 45–135°, and none by more than 135°. Median directed angle: 10.43°. All nine retained clusters fall below 45° (median 3.42°). These are agreements between two correlated projected-motion methods, not accuracy against physical spin truth.
The sign depends on which systems are included
These are pooled 104 H values, not map amplitudes ΔH. The original joint group–cluster screen is held fixed; no sample cut is retuned.
| Sample | N | Regression | Half-plane |
|---|---|---|---|
| All fitted groups | 1,929 | −2.741947 | −3.205278 |
| Groups retained by the joint screen | 1,713 | +0.273061 | −0.322342 |
| All fitted groups plus all clusters | 1,939 | −2.066542 | −2.439433 |
| Retained groups plus clusters (poster sample) | 1,722 | +0.673972 | +0.210983 |
Starting with all groups, screening alone changes the regression sign. The half-plane result remains negative until the retained clusters are included. Adding all ten clusters before screening leaves both values negative. Each sample uses its own pair denominator, so increments depend on the order of the two sample changes. This is an arithmetic decomposition, not causal attribution.
| Pair class in the displayed sample | Pairs | Contribution to 104 H: regression | Half-plane |
|---|---|---|---|
| Group–group | 1,466,328 | +0.270213 | −0.318980 |
| Group–cluster | 15,417 | +0.445736 | +0.569609 |
| Cluster–cluster | 36 | −0.041977 | −0.039645 |
| Total | 1,481,781 | +0.673972 | +0.210983 |
All contributions use the full displayed-sample pair denominator. The positive total does not mean the cluster-only result is positive; cross-pairs contribute substantially. All 13 independent numerical verification checks passed. No classification, fit, random stream or significance test was repeated.
Calibration assumptions and review scope
The historical SpArcFiRe estimate −0.06% [−4.44%, +4.32%] assumes shared class errors that transfer from Galaxy Zoo/CzSL and equal CW/ACW resolution. The [−19.07%, +11.10%] range permits cohort-specific errors under a different model and joint confidence construction. Neither is a current Fourier calibration.
Claude Code reviewed sources and controls in contexts separate from source authoring. Gemini's review covered limited text and primary references, not the full poster or packet. Kimi's single bounded credit request produced no usable review; earlier Kimi feedback is historical only. Model review is not journal peer review or independent observational evidence. Compiled-code provenance, absolute orientation, selection and calibration transfer remain limitations.
No statistically established physical spin-parity detection is claimed. The maps remain useful descriptions of method and axis dependence; the new decomposition shows why the group/cluster result must also be interpreted with its sample definition.
Read the full audit and verification summaryPreserved v67 poster
Theory: spin alignment and parity are different
Physical spin is actual rotation; image handedness is the apparent clockwise or anticlockwise outward winding of spiral arms. Our galaxy-image methods measure winding, with assumptions needed to infer physical rotation. Mirror symmetry means that a population pattern and its mirror-reversed counterpart are equally likely; it does not require each galaxy to look symmetric or a finite sample to contain exactly equal counts. Standard parity-symmetric LambdaCDM permits gravitationally generated spin correlations without a cosmic handedness preference. Primordial chirality and rotating black-hole-universe proposals remain theoretical motivations, not specific models tested by these measurements. Section 1 uses one compact CW/ACW schematic, restores a separate card on theoretical motivation, and explains the standard LambdaCDM baseline; all measured results are retained.
Lee & Pen (2001), Galaxy Spin Statistics and Spin-Density Correlation; Shim et al. (2025 revision), Probing vector chirality in the early Universe. These are theoretical motivation, not a claim that our winding maps measure three-dimensional helicity.
Previous v64 poster · Previous v63 poster · Previous v62 poster · Previous v61 poster · Previous v60 poster · Previous v59 poster · Previous v58 poster · Previous poster v57 | v56 archive
10 October follow-up: no significant Fourier directional pattern
Fourier dipole amplitude is 1.65% on all 49,007 assigned targets (approximate 95% Wald envelope 0–6.03%) and 2.16% on the 30,910 targets shared with SpArcFiRe (0–7.68%). All four predeclared conditional tests have Bonferroni-adjusted p = 1.0. The maps remain useful descriptions of how imbalance changes with axis choice; they do not establish physical spin or cosmic parity violation.
The report adds current Fourier comparisons with the exposed Galaxy Zoo reference subsets and retains disagreements, missing cases and selection limits. These references are not representative population truth, and the two methods are correlated. Poster v68 includes this follow-up; the group/cluster results are unchanged.
Poster v56: reviewed Fourier results added
Poster v56 adds the reviewed Fourier full/common dipole amplitudes, approximate uncertainty envelopes and four conditional test results. Galaxy images, observed maps, theory card and group/cluster section are retained. The maps describe axis-dependent contrast; no statistically significant directional pattern is established.
Theory and what the maps mean
No statistically established spin-parity detection: the saved SpArcFiRe directional test has global shuffle p = 0.684. The new Fourier full/common follow-up also found no significant directional pattern under its conditional shuffle null (four-test Bonferroni p = 1.0 for each test). The displayed 1,722-system group/cluster sample now has conditional whole-system and spatial-block sign tests; every separately Bonferroni-adjusted p-value in these two families is 1. This is not a probability of randomness. We can nevertheless describe how the measured contrasts vary with the dividing axis and compare methods, conditional on the observed samples.
Does a rotating black-hole universe imply parity violation?
Poplawski, Universe in a rotating black hole and preferred axis (2025 revision) proposes that a universe inside a rotating parent black hole could inherit a preferred axis and show a spin-direction asymmetry. This is speculative motivation, not an established prediction for our estimator. Rotation or an axis alone does not establish parity violation: angular momentum is an axial vector, unchanged by spatial inversion. Isotropy and parity are different symmetries.
Shim et al., Probing vector chirality in the early Universe (2025 revision) use parity-breaking initial conditions in simulations and show that halo-spin correlations can retain primordial chirality. Our projected proxies and hemisphere maps are not a quantitative test of that model. A reproducible parity-odd cosmological signal, after excluding observational systematics, would challenge the usual parity-symmetric LambdaCDM initial conditions; an observed map contrast alone would not.
Antipodal axes: why the signs reverse
For any pole n, Delta(n) is the statistic in its toward hemisphere minus that in the opposite hemisphere. Reversing the pole exchanges those two sets, so Delta(-n) = -Delta(n), wherever both cells are defined with the same boundary rule. On the sky the opposite pole is (RA + 180 degrees modulo 360, -Dec). Thus (30, +30) pairs with (210, -30), not (210, -60). On a rectangular RA-Dec map this is a 180-degree horizontal shift plus a vertical reflection, not a simple left-right mirror. This is an algebraic property of the display, not an empirical detection.
The two methods on each scale
SpArcFiRe: trace and fit spiral-arm segments, combine their winding evidence and retain unresolved outcomes. Fourier: map image intensity into log radius and angle, compare opposite radial-frequency powers in the two-arm mode, then antisymmetrize the score with the mirrored image. The display sign is fixed by algebra and synthetic orientation checks. All 49,007 retained tensors received signs, which is not the same as validated quality; agreement with SpArcFiRe on 30,910 common targets is 60.8%.
Regression: fit a constant plus sine and cosine to member line-of-sight velocities versus position angle. Half-plane: rotate a dividing line, calculate the difference of the two mean velocities, and extract its first harmonic. Both recover a projected direction of maximum velocity, not a full three-dimensional spin. H is the dimensionless pair-handedness statistic of these directions; Delta H compares its two hemispheres. The maps use the same 1,722 systems (1,713 groups and 9 clusters) after the fixed proximity screen. Leaving out one system at a time gives sensitivity ranges, not confidence intervals or detection significances.
Earlier galaxy and 102-system pilot summary (archived)
Spin-parity violation would mean that physical spin-pattern statistics differ from those of a mirror-reflected Universe. A measured image-winding or velocity-pattern imbalance can also arise from observation and selection biases, so it is not by itself a violation.
No preferred galaxy direction established
The fitted galaxy dipole amplitude is 2.27%, with an approximate 95% range from 0.00% to 7.79%. The global label-shuffle p-value is 0.684, including the search over direction.
Group and cluster result depends on sample choices
For the earlier 102-system combination (including 12 published systems), the projected-direction statistic is H = +0.0203. Removing the group sample changes it to −0.0249. These selected systems do not establish physical spin or cosmic parity violation.
1 · Galaxy winding and sky direction
The retained SpArcFiRe pipeline classifies the winding visible in galaxy images. Of 49,211 scheduled images, 30,910 are resolved: 15,479 clockwise (CW) and 15,431 anticlockwise (ACW); 18,301 remain unresolved.
This observed count imbalance is distinct from a calibration-adjusted population estimate. The unresolved cases and their selection remain important.
The main directional test is a fitted dipole
Three different quantities: map colour is an observed difference between two hemispheres; 2.27% is the fitted dipole amplitude, not the map maximum; -0.06% is the pooled calibration-adjusted overall imbalance. The pooled range [-4.44%, +4.32%] is uncertainty under its assumptions, not signal strength. These quantities cannot be compared as though they were the same measurement.
The model fits an overall balance and three dipole components using each galaxy’s sky position. The components describe one freely oriented direction and an amplitude. Because the result is consistent with zero, the fitted axis is not an established cosmic direction.
The poster’s observed sky map is different: each map pixel is a possible dividing axis. Its colour is the measured winding imbalance in the hemisphere toward that axis minus the imbalance in the opposite hemisphere. It is not a picture of galaxies on the sky and not a detection-significance map.
| Display summary around the fitted direction | Observed imbalance | Nominal 95% counting range | Resolved counts |
|---|---|---|---|
| Half 1 | +0.63% | −0.74% to +2.01% | 10,232 CW / 10,103 ACW |
| Half 2 | −0.77% | −2.67% to +1.14% | 5,247 CW / 5,328 ACW |
The same data fitted the axis. These two ranges omit axis-selection uncertainty, calibration error and selection effects; they are exploratory descriptions, not independent confirmations of the dipole.
What would spin-parity violation imply?
Parity compares a physical configuration with its spatial mirror. A cosmic parity asymmetry would mean that suitable spin-pattern statistics systematically distinguish the two. Standard LambdaCDM with parity-symmetric initial conditions and standard gravitational evolution has no ensemble preference for one handedness. Local alignments and fluctuations in a finite sample are allowed.
A reproducible cosmic parity-odd signal, after observational and selection effects are excluded, would challenge that standard baseline and could motivate new physics. It would not, by itself, disprove the existence of dark matter or dark energy. Directional anisotropy and parity violation are distinct: a fitted sky dipole alone is not a proof of parity violation. Our present results do not establish either a preferred galaxy direction or a robust spin-parity detection.
Primary context: Patel & Desmond (2024), galaxy spin-direction anisotropy; Philcox (2022, revised 2023), parity-odd large-scale-structure statistics. The latter uses a four-point correlation function, not our winding or projected-motion estimator; its measurement is not imported into ours.
Two measurement algorithms, one target inventory
Both algorithms now cover the same 49,211 attempted targets. SpArcFiRe labels are the stored ones. The frozen Fourier estimator attempted each of the 49,007 retained image tensors once; 49,007 resolved; 204 targets have no retained tensor. Nothing was tuned on outcomes and nothing was scored twice.
| Algorithm | Resolved | CW | ACW | Pooled A in percent (nominal 95% Wilson range) |
|---|---|---|---|---|
| SpArcFiRe (stored) | 30,910 | 15,479 | 15,431 | +0.155 (-0.959 to +1.270) |
| Fourier (single new pass) | 49,007 | 24,644 | 24,363 | +0.573 (-0.312 to +1.459) |
The Wilson ranges are nominal count ranges, conditional on the labels as assigned and on targets treated as independent. They exclude classification error, selection and dependence. The Galaxy Zoo / CzSL calibration below was measured for SpArcFiRe only and is not transferred to Fourier. Both outputs are image-winding proxies on previously exposed data, not physical spin.
Joint outcome for all 49,211 targets
| SpArcFiRe CW | SpArcFiRe ACW | SpArcFiRe unresolved | |
|---|---|---|---|
| Fourier CW | 9,491 | 6,131 | 9,022 |
| Fourier ACW | 5,988 | 9,300 | 9,075 |
| Fourier unresolved | 0 | 0 | 204 |
30,910 targets are resolved by both algorithms; their labels agree for 18,791 and disagree for 12,119. The common-resolved set is defined by coverage, not by agreement, and every disagreement stays in it.
2 · Calibration: Galaxy Zoo and the CzSL human labels
“Expert” refers to a human-labelled reference sample associated with CzSL (Jiménez et al. 2023), not an AI reviewer. The retained expert-reference calibration uses 5,397 jointly resolved comparisons from a separate 6,000-target cohort. Galaxy Zoo provides 213 jointly resolved high-consensus comparisons.
The 206-image development comparison (182 agreements), mentioned in earlier project notes, is a different subset and is not the 5,397-case directional calibration. Human reference labels are a calibration standard, not direct measurements of physical spin.
| Reference sample | Reference CW classified ACW | Reference ACW classified CW |
|---|---|---|
| Galaxy Zoo consensus | 3 / 105 | 7 / 108 |
| CzSL human expert labels | 196 / 2,685 | 200 / 2,712 |
We keep four calibration scenarios visible. Here, a cohort means a calibration sample: Galaxy Zoo or CzSL. The shared-error scenario assumes the same directional classification-error rates in both. The broader scenario allows the science-sample error rates to lie between the specified GZ and CzSL brackets, including their calibration uncertainty. More corrections remain possible, so its range is widest among the four displayed scenarios. This is a weaker assumption, not a claim that adding data inherently makes a measurement worse or that a difference has been established.
| Scenario | Conditional range for winding imbalance | Key assumption |
|---|---|---|
| Galaxy Zoo only | −17.93% to +10.03% | GZ directional error rates transfer |
| CzSL human labels only | −4.37% to +4.56% | CzSL directional error rates transfer |
| Combined, shared error rates | −4.44% to +4.32% | A common calibration population and common errors; point estimate −0.06% |
| Allow different GZ / CzSL errors | −19.07% to +11.10% | Science error rates fall within the specified cohort brackets; no unique point estimate |
These are 95% conditional ranges with simultaneous binomial-margin control: M3 for the first three scenarios and M5 for cohort bracketing. They assume equal CW/ACW resolution (d = 0). Full-population transfer is not validated. In the retained pooled selection-sensitivity scenarios, d = −1%, 0%, +1% changes the estimate to +0.94%, −0.06%, −1.06%, respectively. These are assumed-bias scenarios, not measured selection corrections.
3 · Groups and clusters: a smaller exploratory test
The earlier combined map, retained in the archived poster, uses 102 systems: 80 of our groups, 10 of our clusters and 12 published Hwang & Lee systems. Abell 2107 is a separate case study and illustration; it is not an extra entry in this 102-system map.
| Sample | What was analysed | Interpretation |
|---|---|---|
| 80 selected galaxy groups | 1,434 member spectra. Median fitted velocity-pattern amplitude 127 km/s; middle half 77–196 km/s. 23 / 80 fits predict left-out members better than a constant. | Fixed catalogue selection, not a representative population sample. Member-by-member prediction differs from the spatial holdout used for clusters. |
| 10 of our clusters | Four overlapping predictive checks each: 40 comparisons, not 40 clusters. The rotation-shaped model beats a constant in 5 comparisons; a constant is best in 28. | No cluster is claimed as a validated physical spin. A separate corrected-detection export withholds all ten directed axes; the map uses explicitly exploratory retained coefficients. |
| 12 published systems | Hwang & Lee (2007): all 12 retained, including six the authors did not call probable rotators. | Literature systems were selected for large apparent motion. Superposition and substructure can mimic rotation. |
| Group and A2107 illustrations | Group example: the first retained selection slot, chosen without inspecting its velocity pattern. The new Legacy Surveys DR9 photograph shows its central 10 arcmin; the saved member-velocity plot remains in the archived poster. A2107: our separate 285-member spectroscopic case. The SDSS photograph shows its central 10 arcmin; its wider velocity diagram remains in the archived poster. | A projected velocity pattern is not a confirmed physical spin. Colour in the velocity plot represents line-of-sight motion, not a measured CW/ACW label. |
Published papers do not all report compatible directed measurements. Some provide only an unsigned axis, folded alignment angle or stacked gas signal. Such results inform the discussion but cannot be inserted as individual signed directions without unsupported assumptions. The broader retained survey covers Hwang & Lee, Manolopoulou & Plionis, Song and other optical/gas analyses, retaining weak, missing and conflicting entries.
What is H?
H is a dimensionless pairwise-handedness statistic of projected motion directions. It uses the sky position of each system and the direction in which its fitted line-of-sight velocity increases. It is not a velocity, a rotation amplitude, or a CW-minus-ACW count.
Let ni be the unit vector toward system i. Let gi be its projected velocity-gradient direction, normalized to unit length. Define qi = ni × gi. For N systems:
This equals an average of signed geometric terms across distinct system pairs. Positive and negative values represent opposite handed geometric arrangements. Zero means no net pairwise handedness in this statistic, not proof that the Universe preserves parity. Reversing all velocity directions leaves H unchanged; spatial inversion changes its sign. A zero fitted gradient stays zero and still counts in N.
How to read the earlier 102-system group/cluster sky map
At each candidate axis, split systems into a “toward” and an “opposite” hemisphere, and display ΔH = H(toward) − H(opposite). That earlier map has a fixed 10° grid (648 cells), masks halves with too few systems, and uses a signed-square-root colour scale. The current matched maps use the linear scale described in the method-map section. Earth, ecliptic and Galactic poles are reference markers. No strongest-axis significance is claimed. At a fixed candidate dividing axis, simultaneously inverting the data directions (n, g) to (−n, −g) reverses H and swaps the two halves, leaving ΔH unchanged. This statement holds the candidate axis fixed; it does not invert the axis as well.
Why we show sensitivity instead of a confidence bar
For the earlier 102-system combined sample, H = +0.0203. Removing one system at a time gives +0.0175 to +0.0240. Removing the whole group sample gives −0.0249. The first is a leave-one-system sensitivity range, not a confidence interval; neither calculation propagates all measurement and selection uncertainty.
A separate retrospective conditional sign-randomization check gives a raw p-value of 0.054 for combined unit H and a Bonferroni-adjusted value of 1.00 across 19 tests. It holds the selected sample and fitted directions’ geometry conditional; it is not a universal cosmic-parity null model.
Maps separated by measurement method
Galaxies: two algorithms, same inventory
Each colour shows ΔA = A(toward the candidate dividing axis) − A(opposite), with A = (CW − ACW)/N, on 648 axes of a 10-degree grid. The poster shows each algorithm on its own resolved set, with one shared linear colour scale that saturates at ±5 percentage points. Map cells span -2.1 to 2.1 pp for SpArcFiRe and -2.0 to 2.0 pp for Fourier; these spans describe the maps and are not uncertainty ranges. Grey cells have fewer than 30 galaxies in a half, or a boundary tie. Maps restricted to the 30,910 common-resolved targets are in the downloadable aggregate file. The saved SpArcFiRe dipole fit remains the historical result (2.27%, approximate 95% Wald envelope 0.00% to 7.79%, global shuffle p = 0.684). The 10 October follow-up separately fitted Fourier full/common samples and tested their dipoles and maximum hemisphere contrasts; all four conditional Bonferroni-adjusted p-values are 1.0. See the linked supplement for amplitudes, uncertainty and assumptions.
Orientation: the displayed Fourier sign is −machine sign, fixed by the estimator algebra and a synthetic calibration, not chosen from agreement.
Groups and clusters: two measurement methods
Poster v69 shows regression and half-plane only. The correlated mean is retained below as an archived descriptive result, not a third independent measurement.
All 1,934 eligible groups stay in the accounting: 1 was refused at source validation, 4 have no primary-aperture fit, and 1,929 have a regression fit, of which 1,929 also have a half-plane estimate. Of 10 retained clusters, 10 contribute regression and 10 contribute half-plane vectors. A fixed proximity screen (3 Mpc and 3000 km/s) removed 217 systems in overlapping components (216 groups, 1 cluster) from every map.
| Set | Systems | Groups | Clusters | 10^4 H (unit vectors) |
|---|---|---|---|---|
| Regression, own coverage | 1,722 | 1,713 | 9 | +0.674 |
| Half-plane, own coverage | 1,722 | 1,713 | 9 | +0.211 |
| Regression, common systems | 1,722 | 1,713 | 9 | +0.674 (leave-one-system +0.023 to +1.319) |
| Half-plane, common systems | 1,722 | 1,713 | 9 | +0.211 (leave-one-system -0.416 to +0.839) |
| Mean of the two, common systems | 1,722 | 1,713 | 9 | +0.442 |
ΔH(axis) = H(toward) − H(opposite)
Mean map = (ΔH regression + ΔH half-plane) / 2
The two poster maps use the same 1,722 systems, identical partitions and masks (at least three systems in each half) and one linear colour scale from -100 to 100 in units of 10^4 Delta H; colours saturate at the ends. All H values and sensitivity ranges in this table are multiplied by 10,000 for readability. This fixed display multiplier does not change the measurements. H is dimensionless pair handedness of projected motion directions: not a velocity, not a CW/ACW fraction and not a detected rotation. The mean combines two correlated estimates of the same systems; it is not an independent pool, not a confidence interval and adds no precision. Leave-one-system ranges are sensitivity ranges, not confidence intervals. The 12 literature-only systems have no second matched estimator and stay in the earlier comparison above.
Group-core photograph: Legacy Surveys DR9 documentation; the core image is illustrative, not the membership footprint.
What remains uncertain
- Image winding does not identify full three-dimensional angular momentum. Projected group/cluster motion can be produced by substructure, streaming or superposition.
- Calibration errors may not transfer across reference samples and the science population. Unresolved galaxies may have direction-dependent selection.
- The sky footprint, source selection and possible residual dependence matter. A proximity screen does not prove independent membership.
- Retrospective splits and known results are not untouched validation data. Model/provider reviews check methods and communication, not physical truth or conventional journal peer review.
The appropriate conclusion is a measured, assumption-labelled feasibility result: no robust physical spin-parity detection has been established by these analyses.
Selected primary references
- Land et al. (2008), Galaxy Zoo and galaxy-spin statistics
- Hayes et al. (2017), selection and chirality tests
- Shamir (2021), reported directional winding asymmetry
- Patel & Desmond (2024), dipole inference and catalogue reanalysis
- Jiménez et al. (2023), CzSL: citizen-science and expert labels
- Hwang & Lee (2007), cluster rotation candidates
- Manolopoulou & Plionis (2017), cluster rotation analysis
- Song et al. (2018), A2107
- DESI DR1 group-finder value-added catalogue documentation
- SDSS SkyServer, processed A2107 context image; it is not a numerical input to this poster update.
Different publications use different observables, apertures, conventions and selection rules. Their quoted directions and significances are not treated as a homogeneous pooled cosmic-parity measurement.
Archived image example (v53 and earlier)
The photograph in the archived v53 poster section 3 shows the central 10 arcmin of one of our 80 selected DESI galaxy groups, from the Legacy Surveys DR9 processed imaging service. The selected group has 15 spectroscopic members; this core view does not show the full membership footprint. The original member-velocity diagram remains in the archived poster. The first retained group slot was chosen before inspecting its velocity pattern. It is not the Milky Way Local Group and is not a confirmed spinning group.
Group/cluster review and map units
The group/cluster maps retain 104 × ΔH. H is a dimensionless pair-handedness statistic of equally weighted projected-motion directions, not a fraction of rotating systems. A displayed value of 100 corresponds to ΔH=0.01; it does not mean 100% of systems. Galaxy maps already use percentage points: ΔA=0.02 is 2 percentage points.
Opposite dividing axes reverse the contrast by construction. The detailed amplitudes and patterns still depend on the data. For the displayed 1,722 systems, conditional sign-null tests and formal redshift-error propagation have now been evaluated. Neither supplies a complete uncertainty model. The leave-one ranges still measure sensitivity only; the earlier pilot tests remain separate.
The source review resolved the historical cluster angle definitions without finding a sign error; no sign was changed and no scientific analysis was rerun. These results are descriptive projected-motion patterns, not detections of physical spin or cosmic parity violation.
Contributions and AI assistance
Duho Kim provided the original research idea and supervised the study. Under Duho Kim's supervision, the AI workflow led by Codex carried out the computational work: implementation, data processing and analysis, literature synthesis, validation checks, figures, poster preparation and drafting. Claude contributed code drafts; Claude, Gemini and Kimi reviewed code, methods and interpretation.
Observational data, human reference labels and existing software remain credited to their original sources. This statement describes the work performed for this study.
Poster v69
The Take away distinguishes the displayed full resolved/assigned samples (SpArcFiRe 30,910; Fourier 49,007) from the separate matched comparison: SpArcFiRe and Fourier give different galaxy spin (winding-handedness) imbalance patterns, even on the same 30,910 galaxies. Neither galaxy method establishes a statistically significant preferred sky direction. The v69 third takeaway states that group/cluster H is sensitive to selection and centre choice and that conditional sign-null tests show no excess. The separate 11 October saved-vector audit shows negative H for both methods on all 1,929 fitted groups without screening, but positive H on the displayed 1,713 screened groups plus 9 clusters. The 11 October saved-vector audit separates these sample changes arithmetically: screening alone changes the regression sign, while half-plane H remains negative until the retained clusters are added. These conclusions refer to the fixed joint screen and do not establish causation or significance. Omitting one system can also reverse the displayed half-plane sign. These leave-one-out ranges describe sensitivity, not confidence intervals. The maps describe how observed imbalance changes with the dividing axis; method dependence alone is not a detection of cosmic parity violation.
Original v69 PDFPrint copy with embedded fontsOpen poster image